Data Visuallization

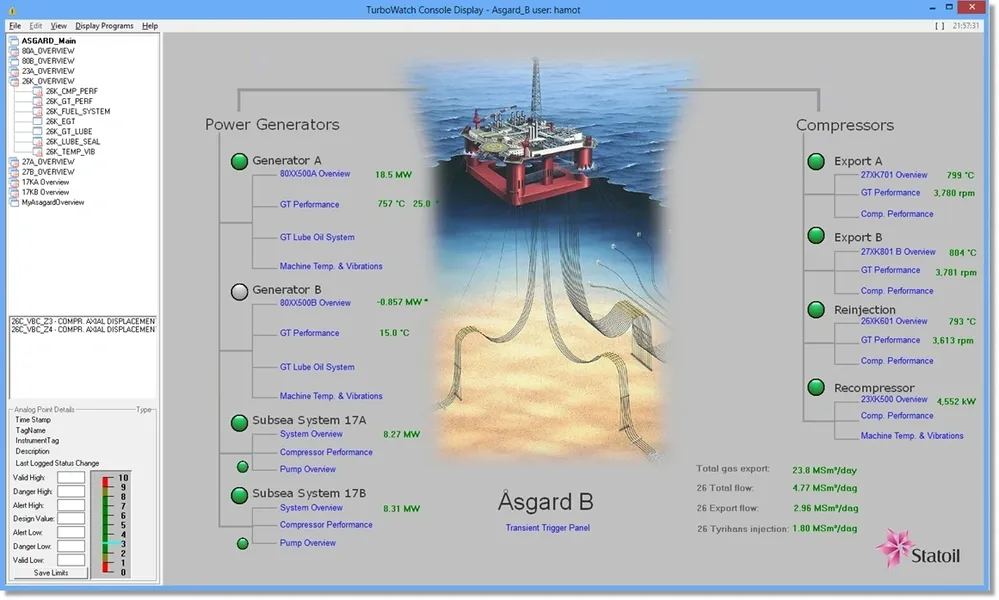
HMI Console Display
Provides a graphical interface to all processes and machinery. View real-time data and quickly navigate plant areas/parameters of interest. Configuration and personalization options allow users complete control over what is displayed and how. In addition, users can have private panels for their own use only or to share with selected users. Can create hyperlinks to launch other TurboWatch display programs or other Windows applications.
Trend Graphs and XY Plots
This display module combines many features for plotting historical time series data and X-Y plots with advanced features for filtering plotted data based on user defined criteria. Also included are many scientific plotting features such as curve fitting, linear and logarithmic axes, zooming etc. The graphs can be easily pasted in other windows applications and can also be saved to file as live plots that can be viewed using the TurboWatch Graphics Viewer utility.


Performance Maps Display
This is a powerful tool for viewing process data overlaid on top of guaranteed or as tested performance curves provided by the manufacturer or obtained from the latest performance tests. This gives an instant health assessment of the machines and also provides easy visualization of operating regimes and deviations from expected behavior.
Histogram and Barcharts
View historical data for parameters of choice in the form of a histogram plot. This helps in visualizing operating trends and deviations from normal operating practices.


Gas Turbine EGT Plots
The Turbine Exhaust Gas Temperature Plots with temperature spreads are a key analysis tool useful in identifying gas turbine hot section problems such as nozzle blockages and distortions. User can view real-time data or scroll through historical steady state or transient data captured during a startup, shutdown or trip.
Text Reports
The text report utility includes several different formats and allows export of data in spreadsheet format. Can also import and display data from other OPC HDA compatible systems. Besides process data the utility also displays alarms, events and system error logs.

